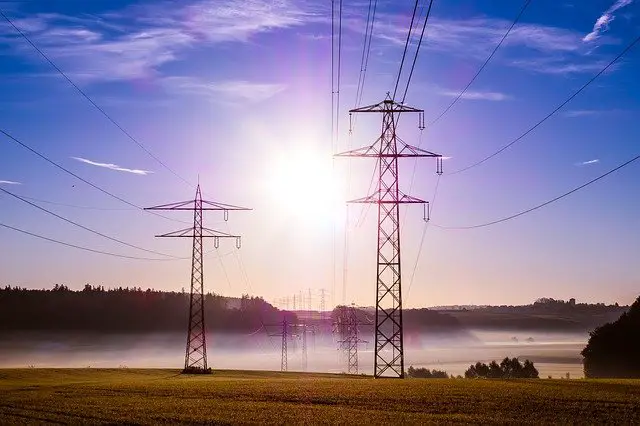
The energy mix of a country (or city) is the mix of energy sources that provide that country’s primary energy, or specifically electricity for their power grid.
Below, we outline the energy mixes of some of the biggest energy consuming countries in the world.
Summary – The Global Energy Mix (Energy Sources The World Gets It’s Energy From)
Which Energy Sources Provide The Most Energy Globally
Globally, fossil fuels still provide most of the world’s energy across major metrics like energy consumption and production
For primary energy use, oil has the highest share of primary energy use, with coal in second, and natural gas third. All other energy sources are far behind these three
In particular for energy provided globally, one report indicates that the % share of energy provided globally by fossil fuels has not changed much over the last few decades
For global electricity generation specifically, coal provides the most energy by a significant margin, followed by natural gas
For transport fuels though, petroleum products from crude oil may provide the most energy
In the guide below, we mostly focus on primary energy sources for production or consumption, as well as electricity generation
Energy Mix In The United States
– Primary Energy Production
For primary energy production, natural gas makes up the largest energy share %, followed very closely by petroleum (and crude oil) in second
– Electricity Generation
For electricity generation only, natural gas makes up the largest energy share %, followed by coal
Energy Mix In China
– Total Energy Consumption
Coal has the highest % share of China’s energy consumption by a significant margin
– Electricity Generation
Coal has the highest % share of China’s electricity generation by a significant margin
Energy Mix In India
– Primary Energy Consumption
Coal has the highest % share of India’s primary energy consumption by a significant margin
Energy Mix In Russia
– Total Energy Consumption
Natural gas has the highest % share of Russia’s total energy consumption by a significant margin
– Electricity Generation
Natural gas has the highest % share of Russia’s electricity generation by a significant margin
Energy Mix In Canada
– Primary Energy Production
Crude oil and also uranium have the highest % share of Canada’s primary energy production
Energy Mix In Japan
– Primary Energy Consumption
Petroleum and other liquids have the highest % share of Japan’s primary energy consumption by a reasonable margin
Energy Mix In Brazil
– Primary Energy Consumption
Petroleum and other liquids have the highest % share of Brazil’s primary energy consumption by a significant margin
Energy Mix In South Korea
– Primary Energy Consumption
Petroleum and other liquids have the highest % share of South Korea’s primary energy consumption by a reasonable margin
Energy Mix In Germany
– Power Production
Renewables have the highest % share for power production in Germany by a reasonable margin
Energy Mix In The UK
– Total Energy Use
Gas has the highest % share for energy use in the UK
This is followed very closely by oil
– Electricity Generation
Natural gas is first for % share of electricity generation in the UK by a significant margin
Energy Mix In Australia
– Electricity Generation
Coal has the highest % share for electricity generation for Australia by a very significant margin
Energy Mix In Saudi Arabia
– Total Energy Consumption
Crude oil and petroleum liquids have the highest % share of Saudi Arabia’s total energy consumption by a significant margin
Energy Mix In Italy
– Gross Energy Production
Natural gas has the highest % share of Italy’s grown energy production by a reasonable margin
Some Considerations For The Energy Sector & Energy Mix Of Different Countries Going Forward
At the bottom of this guide, we list some considerations that might be relevant to the energy sector and energy mix of different countries across the world going into the future.
Energy Mix & Energy Sources – Global Average
Primary Energy Supply
On a global scale, oil has the highest share of primary energy use, with coal in second, and natural gas third. All other energy sources are far behind these three
visualcapitalist.com indicates that the following energy sources provided these %’s of the world’s primary energy supply in 2015:
[Oil was first at 31.7%]
[Coal was second at 28.1%]
[Natural Gas was third at 21.6%]
[This is followed by Nuclear at 4.9%, Hydro at 2.5%, Solar at less than 1%, and Wind at less than 1% too]
% Of Primary Energy Provided Over Time
… nuclear and renewable energy has so far not contributed to a big increase in total energy provided – the fraction of global energy provided by fossil fuels is about the same [in 2017] (86 percent) as it was in 2002 (anthropocenemagazine.org)
Energy Consumption For Electricity Generation
On a global scale, coal has the highest average share of energy consumption for electricity generation by a significant margin
Natural gas is second
In 2014, the share of world energy consumption for electricity generation by source was:
[Coal at 41%]
[Natural gas at 22%]
[Hydro was third at 16%, followed by nuclear at 11%, other sources (solar, wind, geothermal, biomass, etc.) at 6%, and oil at 4%]
– wikipedia.org
Read more about worldwide energy production and energy consumption stats at ourworldindata.org
An online search for ‘global energy mix’ or ‘energy sources that provide most of the world’s energy’ will also provide extensive information on the global average energy mix
Energy Mix & Energy Sources In United States
Primary Energy Production
For primary energy production, natural gas makes up the largest energy share %, followed very closely by petroleum (and crude oil) in second
Coal is third
From eia.gov:
[US primary energy production in 2017 was:]
Natural Gas—31.8%
Petroleum (crude oil and natural gas plant liquids)—28.0%
[Coal was third at 17.8%, renewable energy at 12.7%, and then nuclear electric power at 9.6%]
Electricity Generation
For electricity generation only, natural gas makes up the largest energy share %, followed by coal
In 2018, the sources of electricity generation specifically were:
Natural gas – 35%
Coal – 27%
[Nuclear Energy was third at 19%, followed by Renewable energy sources at 17% (Hydropower 7%, Wind 7%, Biomass 2%, Solar 2%, Geothermal less than 1%), and Petroleum at less than 1%]
– eia.gov
Energy Sources For ‘Doing Work’
In the United States and many other countries, most energy sources for doing work are nonrenewable energy sources [such as petroleum, hydrocarbon gas liquids, natural gas, coal, and nuclear energy] (eia.gov)
Summary/Breakdown Of Energy In The United States
Read a summary/breakdown of the energy sector in the United States in this guide.
Energy Mix & Energy Sources In China
Total Energy Consumption
Coal has the highest % share of China’s energy consumption by a significant margin
In 2017, China’s energy consumption breakdown was:
Coal – 60.4%
Crude Oil – 18.8%
[Natural Gas was third at 7%, followed by renewables and other at 13.8%]
– chinapower.csis.org
Electricity Generation
Coal has the highest % share of China’s electricity generation by a significant margin
From wikipedia.org:
[In 2017, China’s electricity generation breakdown by source was:]
Coal – 64.7%
Hydropower – 18.1%
[Wind was third at 4.7%, followed by nuclear at 3.9%, natural gas at 3.2%, other thermal at 1.9%, solar at 1.8%, biomass at 1.2%, and pumped storage hydro at 0.5%]
Summary/Breakdown Of Energy In China
Read a summary/breakdown of the energy sector in China in this guide.
Energy Mix & Energy Sources In India
Primary Energy Consumption
Coal has the highest % share of India’s primary energy consumption by a significant margin
From wikipedia.org:
A primary energy consumption breakdown in India in 2018 was:
Coal – 55.88%
Crude Oil – 29.55%
[Natural Gas was third at 6.17%, hydro electricity at 3.91%, renewable power at 3.40% (excluding traditional biomass use), and nuclear energy at 1.09%]
Energy Mix & Energy Sources In Russia
Total Energy Consumption
Natural gas has the highest % share of Russia’s total energy consumption by a significant margin
In 2018, the % share of energy consumption was:
Natural Gas – 54%
Oil – 21%
[Coal was third at 12%, nuclear at 6.4%, and hydro at 6%]
– bp.com
Electricity Generation
Natural gas has the highest % share of Russia’s electricity generation by a significant margin
In 2018, the % share of electricity generation was:
Natural Gas – 47%
[Nuclear is in second at 18%, followed by hydro at 17%, coal at 16%, and oil at 1%]
– bp.com
Energy Mix & Energy Sources In Canada
Primary Energy Production
Crude oil and also uranium have the highest % share of Canada’s primary energy production
Natural gas is in third
From nrcan.gc.ca:
Primary energy production by source in Canada in 2016 was:
Crude oil – 31%
Uranium – 32%
Natural gas – 24%
[Hydro was equal fourth at 5% along with coal also at 5%, followed by other renewable at 3%, and natural gas liquids at 2%]
Energy Mix & Energy Sources In Japan
Primary Energy Consumption
Petroleum and other liquids have the highest % share of Japan’s primary energy consumption by a reasonable margin
Coal followed by natural gas are in second and third respectively
Japan’s primary energy consumption in 2015 was:
Petroleum and other liquids – 42%
Coal – 27%
Natural gas – 23%
[Hydro is fourth at 5%, other renewables at 3%, and nuclear at around 1%]
– eia.gov
Energy Mix & Energy Sources In Brazil
Primary Energy Consumption
Petroleum and other liquids have the highest % share of Brazil’s primary energy consumption by a significant margin
Hydroelectric power is in second
Brazil’s primary energy consumption in 2017 was:
Petroleum and other liquids – 46%
Hydroelectric power – 28%
[Natural gas is third at 11%, followed by renewables at 8%, coal at 6%, and nuclear at 1%]
– eia.gov
Energy Mix & Energy Sources In South Korea
Primary Energy Consumption
Petroleum and other liquids have the highest % share of South Korea’s primary energy consumption by a reasonable margin
Coal is in second
South Korea’s total primary energy consumption by fuel type in 2017 was:
Petroleum and other liquids – 44%
Coal – 29%
[Natural gas is third at 14%, followed by nuclear at 11%, and renewable sources at 2%]
– eia.gov
Energy Mix & Energy Sources In Germany
Power Production
Renewables have the highest % share for power production in Germany by a reasonable margin
Brown coal is in second
German power production breakdown in 2018 was:
Renewables – 34.9% (wind onshore 14.3%, solar 7.2%, biomass 7%, wind offshore 3%, hydropower 2.6%, waste 1%)
Lignite/Brown Coal – 22.5%
[Black Coal is third at 12.9%, followed by Natural Gas at 12.9%, Nuclear at 11.8%, Other at 4.2%, and Mineral Oil at 0.8%]
– cleanenergywire.org
Energy Mix & Energy Sources In The UK
Total Energy Use
Gas has the highest % share for energy use in the UK
This is followed very closely by oil
UK energy use by source in 2017 was:
Gas – 39%
Oil – 35.8%
[Bioenergy is third at 8.3%, followed by nuclear at 7.9%, coal at 5.3%, wind, solar and hydro at 3%, and imports at 0.7%]
– carbonbrief.org
Electricity Generation
Natural gas is first for % share of electricity generation in the UK by a significant margin
Renewables and also nuclear are second and third
Electricity generation in the UK in 2016 was:
Natural Gas – 42%
Renewables (wind, wave, marine, hydro, biomass and solar) – 24.5%
Nuclear – 21%
[Coal is fourth at 9%, followed by other fossil fuels at 3.1%]
– energy-uk.org.uk
Energy Mix & Energy Sources In Australia
Electricity Generation
Coal has the highest % share for electricity generation for Australia by a very significant margin
In 2015, electricity generation by energy source was:
Coal – 73%
Natural Gas – 13%
[Hydropower is third at 7%, followed by wind at 4%, rooftop solar at 2%, and bioenergy at 1%]
– originenergy.com.au
Energy Mix & Energy Sources In Saudi Arabia
Total Energy Consumption
Crude oil and petroleum liquids have the highest % share of Saudi Arabia’s total energy consumption by a significant margin
Natural gas is second
In 2016, energy consumption by energy sources was:
Crude oil and petroleum liquids – 63%
Natural Gas – 37%
– eia.gov
Energy Mix & Energy Sources In Italy
Gross Energy Production
Natural gas has the highest % share of Italy’s grown energy production by a reasonable margin
Hydro is second
Gross energy production in Italy in 2014 was:
Natural Gas – 33.5%
Hydro – 21.5%
[Coal is third at 15.5%, followed by solar at 8%, and the remainder being ‘other’]
– wikipedia.org
Some Considerations For The Energy Sector & Energy Mix Of Different Countries Going Into The Future
Some considerations for energy use or production, and the energy mix in different countries across the world going into the future might include but aren’t limited to:
– There’s a difference between the energy share % of a country’s energy mix that an individual energy source makes up, and the total amount of energy consumed or produced from that energy source
What we mean by this is that, an energy source can decrease in energy share %, but, if total consumption of that energy source is still increasing, there might be a negligible impact that comes from decreasing the energy share of that energy source
One example of this might coal
Several countries are trying to reduce their energy share % of coal, but, in some of those countries, total energy demand and total coal consumption is still going up. In this situation, there might be a negligible impact that comes from decreasing coal’s energy share % (like for example if the intended goal was to decrease emissions or pollutants from coal)
Additionally, an energy source can see it’s energy share % decrease simply by another energy source increasing installed capacity and consumption of energy from that energy source
In this instance, the former energy source isn’t being used less in total – it’s simply being used less as a % compared to the latter energy source
The impact of doing this may also be negligible as all that is happening is total energy consumption is increasing, and the latter energy source is filling the demand gap
– Some down some energy sources into sub categories might help with accuracy in reporting
Renewables is an example of this
Renewables can be broken down into solar, wind, hydro, geothermal and so on
There’s even deeper break downs than this, such as breaking hydro down into the different types of hydro energy, such as pumped hydro, run of the river hydro, and so on
Onshore vs offshore wind energy is another example
In terms of fossil fuels, black coal vs brown coal, and conventional coal vs clean coal may be further examples
– Installed capacity does not always equate to the power from that installed capacity being used by end consumers
What we mean by this, is that the installed capacity of an energy source has to generate energy, and then be able to convert that energy to electricity that gets used from the main power grid
In some countries, there’s a lack of proper integration of newly installed capacity of some renewables, because of factors like not having adequate integration infrastructure, and this may lead to power being lost and not being used from this newly installed capacity
So, just looking at investment in new energy sources, or just looking at installed capacity, may be unreliable metrics to look at
Looking at energy consumed or electricity consumed from energy sources might be more reliable
– The development of energy sources and their technology in the future can impact the energy sector, and the reporting on energy
There’s many potential examples of this, such as improvements in mining and extraction technology, improvements in power plant and fuel efficiency, and more
These developments and improvements should be taken into account
– Electrification of cars and the use of alternate vehicles and fuels should be taken into account
Separate to stationary energy generation, which mainly includes energy used for electricity generation, transport related energy should be taken into account
Electric cars and other alternative vehicles and fuels could see petroleum based fuels and conventional cars used in lower % shares in some countries, and electricity, electric cars, and other energy and vehicles types used in higher % shares
Sources
1. https://www.eia.gov/energyexplained/?page=us_energy_home
2. https://www.eia.gov/energyexplained/index.php?page=electricity_in_the_united_states
3. https://chinapower.csis.org/energy-footprint/
4. https://en.wikipedia.org/wiki/Electricity_sector_in_China
5. https://en.wikipedia.org/wiki/Energy_policy_of_India
6. https://www.bp.com/content/dam/bp/business-sites/en/global/corporate/pdfs/energy-economics/statistical-review/bp-stats-review-2019-russia-insights.pdf
7. https://en.wikipedia.org/wiki/Electricity_sector_in_Russia
8. https://www.nrcan.gc.ca/energy-facts/energy-and-economy/20062#L2
9. https://www.eia.gov/beta/international/analysis.php?iso=JPN
10. https://www.eia.gov/beta/international/analysis.php?iso=BRA
11. https://www.eia.gov/beta/international/analysis.php?iso=KOR
12. https://www.cleanenergywire.org/factsheets/germanys-energy-consumption-and-power-mix-charts
13. https://www.carbonbrief.org/six-charts-show-mixed-progress-for-uk-renewables
14. https://www.originenergy.com.au/blog/about-energy/energy-in-australia.html
15. https://www.eia.gov/beta/international/analysis.php?iso=SAU
16. https://en.wikipedia.org/wiki/World_energy_consumption
17. https://ourworldindata.org/energy-production-and-changing-energy-sources
18. https://www.energy-uk.org.uk/our-work/generation/electricity-generation.html
19. https://www.visualcapitalist.com/worlds-safest-source-energy/
20. http://www.anthropocenemagazine.org/howmuchenergy/
21. https://www.eia.gov/energyexplained/what-is-energy/sources-of-energy.php
','' ); } ?>