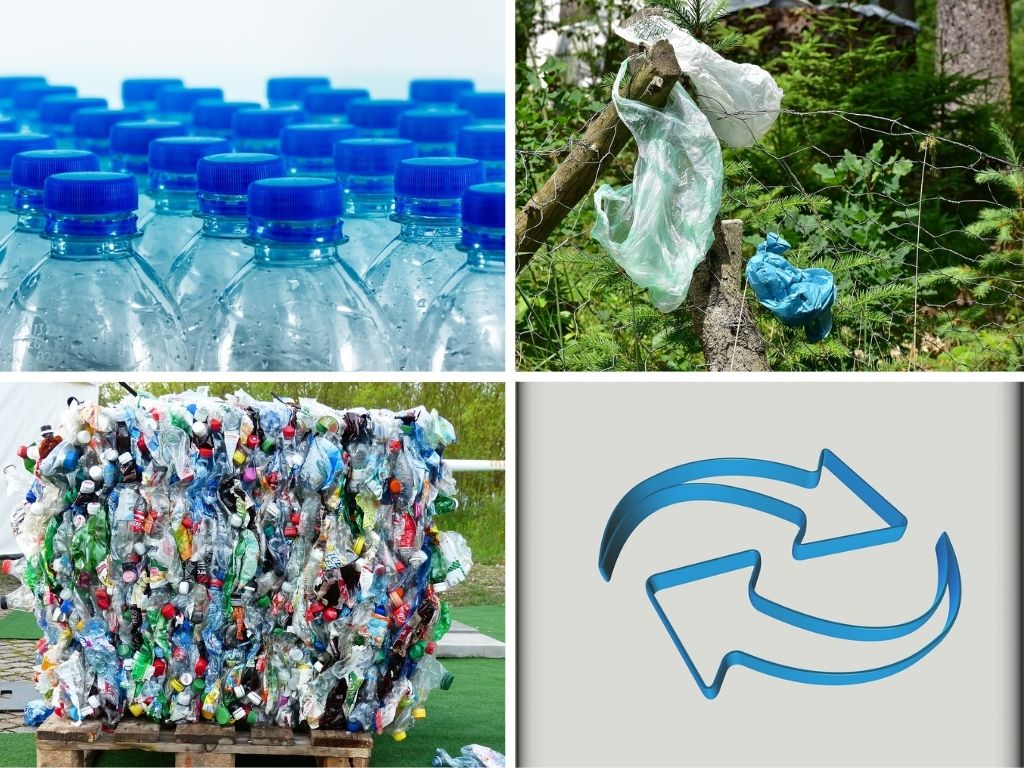
In this guide, we outline what happens to plastic across the main stages of it’s lifecycle in society.
We include some key numbers and stats on production, use, waste, pollution, and the other stages of the plastic lifecycle.
This guide should help illustrate the ‘footprint of plastic’ in terms of where plastic comes from, how it’s used, and where it eventually ends up.
Summary – What Happens To Plastic Over It’s Lifecycle In Society
The Lifecycle Of Plastic
The basic lifecycle of plastic in society is:
– Plastic is produced
– Plastic is used for a range of uses (or gets used and re-used for secondary uses)
– Plastic becomes waste (once it reaches the end of it’s effective lifespan)
– Plastic waste is either effectively managed as waste (landfill, incineration, or recycling), or, it’s littered or inadequately disposed of
– Mismanaged plastic waste (littered, and inadequately disposed of plastic) becomes plastic pollution in the environment, where it can have a number of potential effects
– Some plastic pollution can be cleaned up, but some stays in the environment indefinitely
– Over their lifetime, plastic materials and items can break down into microplastics and nano plastics, and these very small fragments of plastic can end up in a range of places
Where Does Most Plastic End Up?
As a summary, plastic can end up in one of the three main waste management options, or in soil and freshwater sources, in the ocean, or as microplastics in a range of places
Most of the plastic we produce that goes to waste management ends up in landfill (about 40% to 55%), with incineration in second, and recycling in last.
Plastic that is re-used or recycled initially will eventually reach the end of it’s lifecycle, and go to landfill or incineration anyway.
Some plastic is littered or inadequately disposed of (some regions in particular have high plastic mismanagement rates), and ends up in the environment as macro plastics, or broken down into micro and nanoplastics
Of all plastic produced, about a third ends up in soil and fresh water sources, and about 10% in the ocean
Micro and nano plastics can end up essentially anywhere on Earth, such as in the ocean, in soil and sediments, in tap water, in fresh water sources, in animals, in humans, and more
Plastic, no matter where it ends up, can take a very long time to break down compared to some other materials, which means it has a much longer actual lifecycle than many other materials
Key Trends & Stats On Plastic In Society Over Time
Some of the key stats and trends to point out from data from various sources below are:
– Plastic Production
From 1950 to 2015, annual plastic production, measured in tonnes per year, has increased nearly 200 fold
China produces the most plastic in the world, followed by the US
Plastic packaging is the most produced plastic in the world, followed by building and construction plastic
Plastic production uses about 4% of the world’s annual petroleum production, and another 4% gets burned in the refining process
Plastic production may double by 2036, and may quadruple by 2050
– Plastic Use
Between 1950 to 2015, of all plastic that’s was produced between that period, 30% of it was still in use
– Plastic Waste Generation
Plastic packaging produces the most plastic waste of all industries/sectors
Plastic waste generation may increase four fold by 2050
– Plastic Waste Management
Currently, majority of plastic waste is sent to landfill, followed by incineration, and then recycling as the third most common waste management option
Of the plastic that is recycled, some of it reaches the end of it’s useful lifecycle, and either has to be incinerated, discarded or sent to landfill
– Plastic Pollution
About 2% of plastic waste is littered across all countries on average
Some regions/countries inadequately dispose of their plastic more than others (which gets into rivers and the ocean)
Plastic packaging may be inadequately disposed of at higher rates or total than other types of plastic
It’s estimated that about one third of all plastic ends up in soils and freshwater
Terrestrial plastic pollution might happen at far higher rates than ocean plastic pollution
Plastic pollution in the ocean might double by 2030
The General Lifecycle Stages Of Plastic Across Society
The general lifecycle stages of plastic across society, from beginning to end, might include
– Plastic Production
There are different types of plastic.
These different types of plastic are produced in different quantities, and most traditional plastics come from fossil fuel feedstock such as petroleum.
Plastic can be produced as a material, or, it can be produced to be part of a product containing plastic.
– Use Of Plastic
The different types of plastic are used in a range of different uses and applications.
There’s a number of benefits that plastic provides society when used in these different applications.
Packaging is the sector that currently uses the highest share of all plastic produced, with building and construction, and textiles being some of the sectors/industries following behind packaging.
Some plastics may be given a secondary use after serving their primary use (instead of the plastic going straight to waste).
For example, some people may use a plastic bag as a bin liner as a secondary use after using the plastic bag for shopping as a primary use.
– Plastic Becomes Waste
At some point, plastic becomes waste when the consumer makes the choice to discard it, or when it can no longer be used for it’s current use (e.g. it can’t be used in an effective way for it’s current use).
Plastic has different usage lifespans depending on the type of plastic, and what it’s used for.
As just one example, some packaging plastics are single use or highly disposable plastics, and have a high waste rate.
On the other hand, some construction plastics can last decades before they reach the end of their useful lifespan, and become waste.
– Plastic Waste Management, & Mismanagement Of Plastic Waste
When plastic waste is effectively managed, it commonly goes to landfill, recycling or gets incinerated as a part of a city’s waste management system.
However, some plastic waste is mismanaged by either being littered, or it gets inadequately disposed of.
Inadequately disposed of plastic is plastic that isn’t managed properly in waste managed systems. An example might be plastic that leaks from an open dumping site, or that leaks from a landfill site that isn’t contained securely.
Some countries and regions have a much higher mismanaged plastic rate than others due to factors like having ineffective or poorly developed waste management systems.
– Plastic Pollution
Plastic pollution happens mainly on land, and in the ocean.
On land, plastic pollution can impact the soil, freshwater sources, drinking water, the food supply, and more.
In the ocean, plastic pollution can impact marine life in various ways.
There’s ultimately a range of potentially negative effects that plastic pollution can have on humans, wild life and ecosystems.
– Addressing Plastic Pollution
Some plastic pollution can be cleaned up.
However, some plastic stays in the environment indefinitely (and this can happen for a range of reasons)
– Break Down & Decomposition Of Plastic
Plastic eventually breaks down into micro plastics and nano plastics.
This may happen at an earlier stage, such as when plastic fibre based products like clothing are washed in the washing machine, and plastic fragments break off and are discharged in drainage water.
Alternatively, plastic that becomes plastic pollution will break down in the environment.
Plastic can take decades, and often hundreds and thousands of years to break down in landfills, and in the environment.
Most of the plastic ever produced is reported to still be present somewhere on Earth because of how long plastic takes to fully breakdown.
Very very small particles of plastic like micro and nano plastics can break off from larger pieces of plastic at any stage of the plastic lifecycle.
These tiny particles can end up anywhere – inside humans, inside animals, in the ocean, in soil, in freshwater sources, and more
Some reports indicate that micro plastics may end up as deep sea sediment, or washed up and buried in coastlines around the world. But, there might be some uncertainty as to what happens to all the microplastic and plastic that ends up in the environment
Read more about microplastics and the other potentially harmful effects of plastic in this guide
Key Stats & Numbers That Outline What Happens To Plastic
Importing & Exporting Of Plastic
– Top Plastic Exporters
In 2018, China, the US and Germany were responsible for the highest plastic item exports (worldstopexports.com)
Hong Kong, the United States, and Japan grabbed top 3 spots [for the biggest plastic exporters] in the period 1988-2016 (ceoworld.biz)
– Top Plastic Importers
Between 1988 to 2016, China, Hong Kong and the US imported the most plastic (ceoworld.biz)
Generation & Production Of Plastic
– Total Plastic Produced Throughout History
8.3 billion metric tons of [plastic has been manufactured up to the year 2015] (sciencemag.org)
There’s a graph of annual plastic production from 1917 to 2017 available at darrinqualman.com
– Increase In Plastic Production Since 1950
In 1950 the world produced only 2 million tonnes per year. Since then, annual production has increased nearly 200-fold, reaching 381 million tonnes in 2015 (ourworldindata.org)
– How Much Plastic Is Produced Globally Per Day
More than a billion kilograms per day (darrinqualman.com)
– How Much Plastic Gets Produced Globally Each Year
Over 400 million tons of plastic are produced globally each year (sciencedaily.com)
– China Leads Plastic Production
With the largest population, China produced the largest quantity of plastic, at nearly 60 million tonnes. This was followed by the United States at 38 million, Germany at 14.5 million and Brazil at 12 million tonnes (ourworldindata.org)
– Plastic Packaging The Most Produced Primary Plastic
Plastic packaging by far was the most produced primary plastic in 2015 at 146 million tonnes, with building and construction in second place at 65 million tonnes (ourworldindata.org)
– Plastic Packaging As A % of Total Plastic Production
Plastic packaging … is plastics’ largest application, representing 26% of the total volume (weforum.org)
– Oil Used In Plastic Production
4% of the world’s annual petroleum production is diverted to making plastic, and another 4% gets burned in the refining process (wwf.org.au)
– Plastic Production Forecast For The Future
Worldwide plastic production is expected to double within the next 20 years [from 2016 to 2036]—having already multiplied by 20 since 1964 (qz.com)
Plastics production is expected to double again in 20 years and almost quadruple by 2050 (weforum.org)
[There is a] projected four-fold increase in [plastic] production tonnage by 2050 (darrinqualman.com)
– Cumulative Production of Polymers, Synthetic Fibers and Additives In Plastic From 1950 to 2015
8300 million tonnes (ourworldindata.org)
Plastic Waste Generation
– Total Plastic Waste Generated Throughout History
[There has been] 6.3 billion metric tons of plastic waste [throughout history up to the year 2015] (sciencemag.org)
– Industry That Produces The Most Plastic Waste
The plastic packaging industry by far produces the most plastic waste at 141 million tonnes, with ‘other sectors’ in second at 42 million tonnes (ourworldindata.org)
– Plastic Waste In The Future
From sciencemag.org:
In the next 30 years [until 2050], we may produce four times more plastic waste than we ever did
If [current] trends continue, by 2050 we’ll have produced 26 billion metric tons of plastic waste
Waste Management (Landfill, Recycling, Incineration etc.)
– How Plastic Waste Is Managed Globally in 2015
19.5% is recycled, 25.5% is incinerated, and 55% is discarded (ourworldindata.org)
– What Has Happened To All Plastic Waste Up To 2015?
9% was recycled and 12% incinerated. The vast majority, 79%, was tossed (sciencemag.org)
From 1950 to 2015, of all the plastic that has been produced, 30 percent was still in use, 55 percent went straight to landfill or was discarded, 8 percent was incinerated, and 6 percent was recycled (100 million tonnes of recycled plastic was still in use; 100 million tonnes was later incinerated; and 300 million tonnes was later discarded or sent to landfill) (ourworldindata.org)
– What Might Happen To Plastic Waste In The Future?
If [current] trends continue, by 2050 we’ll have … dumped in landfills and the environment (sciencemag.org)
– Recycling Rate Of Plastic
Read more about the recycling rate of plastic in this guide
– Recycling Rate Of Plastic Packaging Specifically
For plastic packaging (water bottles, chip bags, supermarket packaging, etc.) the recycling rate is just 14 percent. But much of that plastic inflow is excluded during the sorting and recycling process, such that only 5 percent of plastic packaging material is actually returned to use through recycling (darrinqualman.com)
From weforum.org:
… 14% of plastic packaging is collected for recycling … In addition to the 14% of plastic packaging collected for recycling, another 14% is sent to an incineration and/or energy recovery process, mostly through incineration in mixed solid waste incinerators, but also through the combustion of refuse-derived fuel in industrial processes such as cement kilns, and (at a limited scale) pyrolysis or gasification …
Furthermore, an overwhelming 72% of plastic packaging is not recovered at all: 40% is landfilled, and 32% leaks out of the collection system – that is, either it is not collected at all, or it is collected but then illegally dumped or mismanaged
Mismanaged Plastic Waste, Inadequately Disposed Of Plastic Waste, Plastic Litter, & Plastic Pollution
– Most Common Plastic Litter Items
– Littering Rate Of Plastic
Some sources ‘assume a rate of littering of 2 percent of total plastic waste generation across all countries’ (ourworldindata.org)
– Inadequately Disposed Of Plastic Waste %
Across many low to middle income countries in South Asia and Sub-Saharan Africa, 80-90 percent of plastic waste is inadequately disposed of, and therefore at risk of polluting rivers and oceans. High income countries see far lower rates. (ourworldindata.org)
– Inadequately Disposed Of Rate Of Plastic Packaging
One third of plastic packaging escapes garbage collection systems entirely and is lost directly into the environment: onto roadsides or into streams, lakes, and oceans (darrinqualman.com)
– Global Share Of Mismanaged Plastic Waste
A high share of the world’s ocean plastics pollution has its origin in Asia. China contributes the highest share of mismanaged plastic waste with around 28 percent of the global total, followed by 10 percent in Indonesia, 6 percent for both the Philippines and Vietnam (ourworldindata.org)
– Plastic Additives In The Ocean
The 150 billion kilograms of plastics currently in the oceans includes 23 billion kgs of additives, all of which will eventually be released into those ocean ecosystems (darrinqualman.com)
– Greenhouse Gases From Plastic
Globally, in this year alone, researchers estimate that the production and incineration of plastic will pump more than 850 million tonnes of greenhouse gases into the atmosphere. By 2050, those emissions could rise to 2.8 billion tonnes (wwf.org.au)
Where All Plastic Ends Up
In terms of plastic that ends up going to waste management, about 40% to 55% of plastic goes to landfill, followed by incineration in second, and recycling in last.
This is evidenced by looking at the low average recycling rate of plastic globally (especially compared to some other materials)
Having said this, some forecasts indicate that recycling and/or incineration may make up a greater shares of plastic waste management than landfill in the future as waste management systems, strategies and policies change
But, not all plastic ends up going to organized waste management options (landfill sites, recycling plants, and incineration plants) – some is littered, and some is inadequately disposed of and ends up in the environment.
About a third of all plastic waste ends up in the soil and freshwater sources, and about 10% of all plastic produced ends up in the ocean.
Some plastic also ends up littered on land and on beaches.
Plastic also breaks down into micro plastics and nanoplastics, and ends up in a range of places such as drinking water, the human body, in wild life, and more
Of the 300 million tonnes of plastic produced each year globally, only 9% is recycled and the remaining 91% enters the air, land and water as waste (biobagworld.com.au)
… [about] 79 per cent [of all plastic waste in history] has been buried in landfills or ended up in nature
… If we continue at the current rate of production without better recycling infrastructure in place, there will be 12 billion metric tons of plastic waste in landfills by 2050
– mytomra.com.au
Just 14% of the plastic packaging used globally makes its way to recycling plants, a third is left in fragile ecosystems, and 40% ends up in landfill (unilever.com.au)
In 2015, 55% of global plastic waste was discarded to landfill, 25.5% was incinerated, and 19.5% was recycled (ourworldindata.org)
Only 9 percent of waste in landfills [is] plastic (alive.com)
From forbes.com “[The reality is] many plastics simply cannot be effectively recycled. Even the most recyclable plastic, PET – or polyethylene terephthalate – is only recycled at a rate of 20-30%, with the rest typically going to incinerators or landfills”.
About a third of all plastic waste ends up in soil or freshwater sources
About 10% of all produced plastic ends up in the ocean
Breakdown & Decomposition
– Break Down Of Plastic In The Environment & In Landfills
– All The Plastic We’ve Ever Produced Exists Somewhere
Except for the tonnage we’ve incinerated, nearly all the plastic ever produced still exists somewhere in the biosphere, although much of it is now invisible to humans, reduced to tiny particles in ocean and land ecosystems (darrinqualman.com)
Plastic On Land
– Where Does Plastic On Land End Up?
It is estimated that one third of all plastic waste ends up in soils or freshwaters. Most of [the plastic produced each year] disintegrates into particles smaller than five millimetres, referred to as microplastics, and breaks down further into nanoparticles, which are less than 0.1 micrometre in size (sciencedaily.com)
– Is Land Plastic Pollution Worse Than Ocean Plastic Pollution?
In fact, terrestrial microplastic pollution is much higher than marine microplastic pollution — an estimate of four to 23 times more, depending on the environment (sciencedaily.com)
– Plastic On Beaches
Plastics make up 85% of beach litter worldwide, 61% of which are single-use plastics and mostly linked to the food industry such as crisp packets, sweet wrappers, food containers and cutlery (lr.org)
Read more about stats and numbers on plastic pollution on land in this guide
Plastic In The Ocean
– How Much Of Total Plastic Ends Up In The Ocean
Of the 260 million tons of plastic the world produces each year, about 10 percent ends up in the Ocean (plastic-pollution.org)
– What Happens To Plastic In The Ocean
There’s also plastic that enters the ocean that is unaccounted for.
– How Much Plastic Is In The Ocean In Total Right Now
Plastic in the ocean can be divided into surface plastic, and total plastic (including underwater plastic).
Although it’s hard to tell exactly how much plastic is in the ocean, some estimates indicate there is around 150 million metric tons of plastic in the ocean in total
– How Much Plastic Goes Into The Ocean Each Year
Most estimates average around 8 million tonnes a year of plastic going into the ocean
– How Much Plastic In The Ocean Comes From Land Sources, & How Much Is From Marine Sources
– Plastic Pollution In The Ocean By 2030
Plastic pollution at sea is on course to double by 2030 (wwf.org.au)
– Plastic In The Ocean By 2050
[At current rates] by 2050, ocean plastic will … outweigh fish in the ocean
– Ocean Plastic Pollution Rates Up To 2050
The proportion of plastic deposited in the ocean is expected to increase at a rate of 4.8% each year until 2025 … and at a rate of 3% from 2025 to 2050 (qz.com)
Read more about stats and numbers on plastic in the ocean in this guide
Read more about stats and numbers on potential solutions to plastic in the ocean in this guide
Sources
1. https://www.sciencemag.org/news/2017/07/next-30-years-we-ll-make-four-times-more-plastic-waste-we-ever-have
2. https://qz.com/599759/by-2050-there-will-be-more-plastic-than-fish-in-the-sea/
3. Hannah Ritchie and Max Roser (2019) – “Plastic Pollution”. Published online at OurWorldInData.org. Retrieved from: ‘https://ourworldindata.org/plastic-pollution’ [Online Resource]
4. https://www.bettermeetsreality.com/plastic-in-the-ocean-faq-guide/
5. http://www3.weforum.org/docs/WEF_The_New_Plastics_Economy.pdf
6. https://www.darrinqualman.com/global-plastics-production/
7. https://www.bettermeetsreality.com/potentially-harmful-effects-of-plastic-on-the-environment-wildlife-humans-health-the-economy/
8. https://www.lr.org/en-au/insights/articles/is-it-realistic-to-go-plastic-free-by-2050/
9. https://www.wwf.org.au/news/blogs/plastic-waste-and-climate-change-whats-the-connection#gs.3b2972
10. https://www.bettermeetsreality.com/most-common-plastic-waste-generated-found-on-beaches-in-oceans-on-land/
11. https://www.bettermeetsreality.com/solutions-to-ocean-plastic-pollution-how-to-stop-reduce-it-how-to-clean-it-up/
12. https://www.bettermeetsreality.com/plastic-pollution-on-land-faq-guide/
13. http://plastic-pollution.org/
14. http://www.worldstopexports.com/plastic-item-exports-country/
15. https://ceoworld.biz/2018/06/27/study-the-top-importers-and-exporters-of-the-worlds-plastic-waste-and-china-wont-accept-plastic-trash-anymore/
16. https://biobagworld.com.au/reduce-plastic-pollution/real-costs-of-plastic-to-our-health-and-economy/
17. https://www.mytomra.com.au/world-environment-day-2019/
18. https://www.unilever.com.au/sustainable-living/the-unilever-sustainable-living-plan/waste-and-packaging/
19. https://ourworldindata.org/grapher/plastic-waste-polymer
20. https://ourworldindata.org/faq-on-plastics
21. https://www.alive.com/lifestyle/plastic-pros-and-cons/
22. https://www.forbes.com/sites/scottsnowden/2019/05/14/scientists-create-a-plastic-that-can-be-recycled-indefinitely/#3d3c9781619c
','' ); } ?>